 All news
Stop wasting time playing detective. The new REDD algorithm will compare your competition for you
17.09.2024
•
News
We are introducing a crucial feature for leasing and asset managers – property comparisons against competitors and the market. Special sections will appear on the refreshed building cards. Say goodbye to tedious work and checking multiple sources simultaneously. From now on, the most important information will always be in one place. We handle the data research – you take care of the rest.
What do leasing managers and detectives have in common? It turns out there are quite a few touchpoints, with the common denominator being the search and verification of information from various, often highly scattered, sources. A leasing manager must have a thorough understanding of the real estate market and keep track of competitor activity. What has been leased, where, and for how much? This knowledge is the starting point for creating attractive offers and is a key metric for property owners and investors. Searching databases, making calls to industry contacts, and manually compiling time-consuming market reports can now be reduced to using a single tool. With just one click, all data can be exported to Excel.
REDD’s updated building card is debuting on the platform, along with new features enabling a quick assessment of market conditions. This solution streamlines a crucial part of a leasing manager’s work, aggregating the most important data in one place. REDD’s specially designed algorithm allows for instant property comparisons with other buildings based on key indicators – tailored to the specifics of both the office and warehouse markets.
“We decided to create a mechanism for selecting comparable properties. Our algorithm is similar for office and warehouse properties but has been adapted to the unique characteristics of each property type. To make the selection, we analyze various property features, such as the distance between buildings, differences in size, completion date, commercial terms, building class, certifications, building type, and other variables. Through mathematical calculations, we measure how different two selected buildings are and then calculate an overall score that reflects the difference between them, allowing us to determine which buildings are the most similar. One of the biggest challenges was selecting the key characteristics that genuinely influence whether buildings are comparable and then tailoring the mathematical operations to calculate these differences accurately. Converting certain property features into numerical values that could be used for calculations, adjusting weights for scoring individual differences, and fine-tuning the method of calculating the values was a lengthy and complex process. After numerous trials, we developed an algorithm that identifies the most similar buildings to the chosen property and accounts for changes over time, enabling us to use it for both analyses and comparisons between buildings,” – summarizes Krzysztof Foks, Head of Research at REDD.
Offices
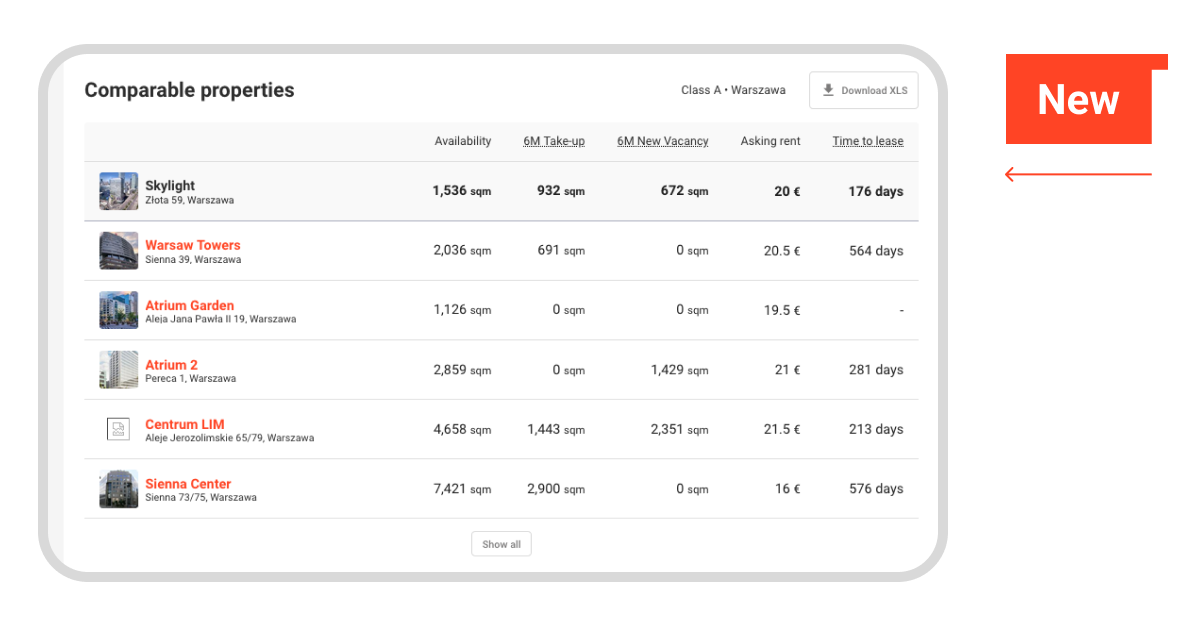
Office building cards have been enhanced with two new sections. The first, “Comparable properties”, allows users to instantly compare a given building with similar properties based on the following indicators:
- Availability
- The total square footage leased in the past 6 months
- The total square footage that became vacant in the past 6 months
- Asking rent
- Time to lease
Additionally, users can assess how the property performs compared to the market. The “Market comparison” section allows the building to be evaluated against 10 competitors of the same class in a given market (e.g., Warsaw – Class A) and office buildings across the entire market (e.g., Warsaw). This comparison is based on the following criteria:
- Vacancy rate
- Time to lease
- Asking rent
- Available space immediately
- Future available space
- Net Take-up
- New vacancy
- Transactions
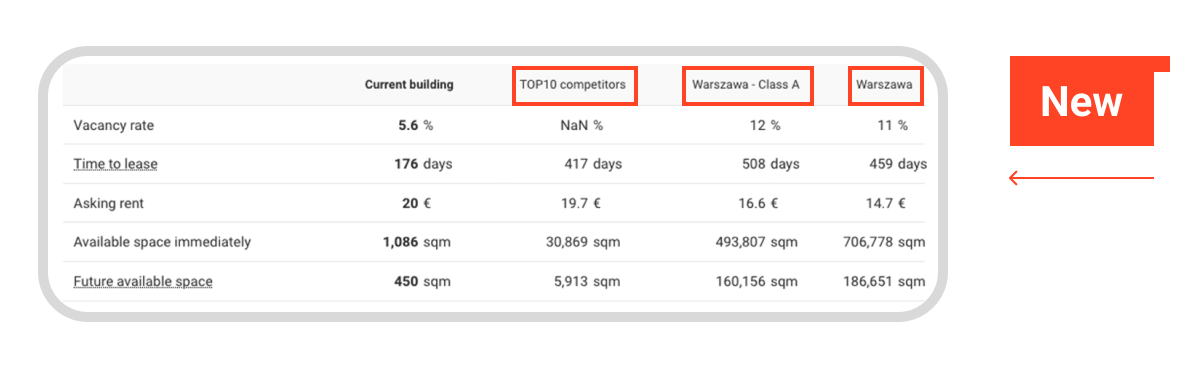
Demand and supply indicators can also be compared over three time periods: 6 months, 12 months, and 24 months.
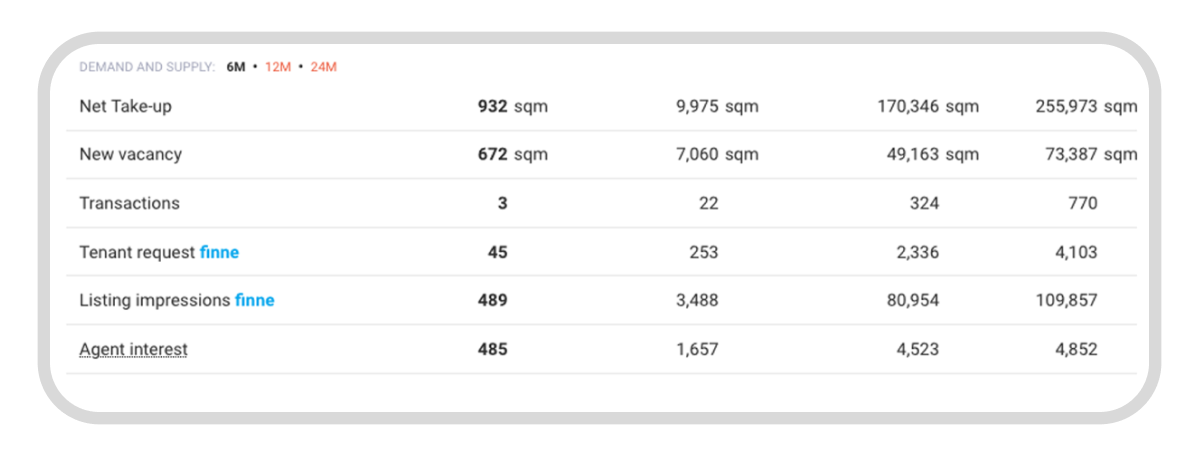
The cherry on top – available exclusively for owned building cards – is data on tenant and agent interest. Leasing managers can see how many views and inquiries their building has generated via the finne.pl portal, as well as track how frequently agents have included this property in lease proposals on the REDD platform. These data points can also be compared against competitor and market results! Thanks to this, office and warehouse owners gain valuable insights into the market and can quickly determine whether a potential issue is specific to their property or shared by competitors and the wider market.
Warehouses
The changes to warehouse building cards have been tailored to meet the needs of the Industrial sector. Now, warehouse park managers gain access to a refreshed “Available space” section, offering a quick overview of both current and forecasted space within their park and competing properties located within 5 km, 5-10 km, and 10-15 km, as well as parks located in the same region and across the entire country. These data are perfectly complemented by a map displaying the number of properties located within specific radii from the original property.
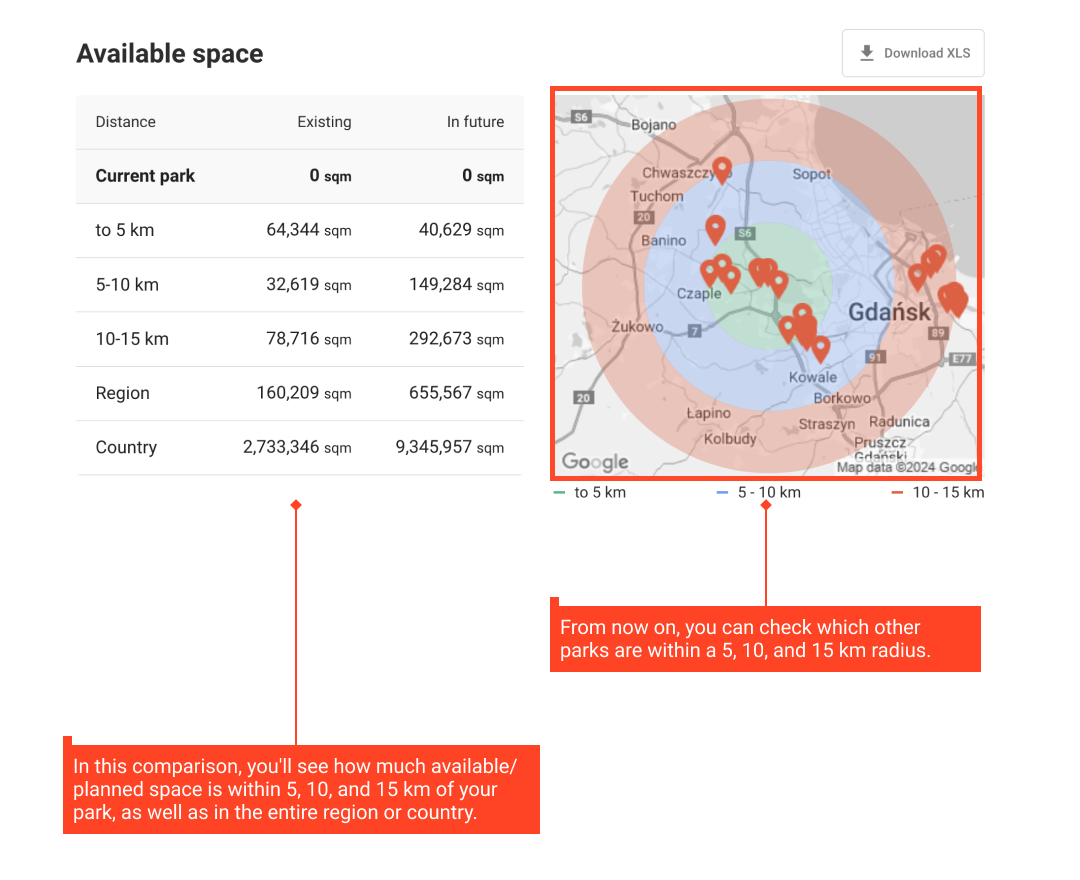
Two additional sections provide valuable market insights: “Supply boost in the region” and “Rent”. These features allow our users to quickly assess how much and when space increased in specific parks within the same region. Users can also instantly compare the rent at a given property with the minimum, average, and maximum rents in the surrounding area, the region, and nationwide.
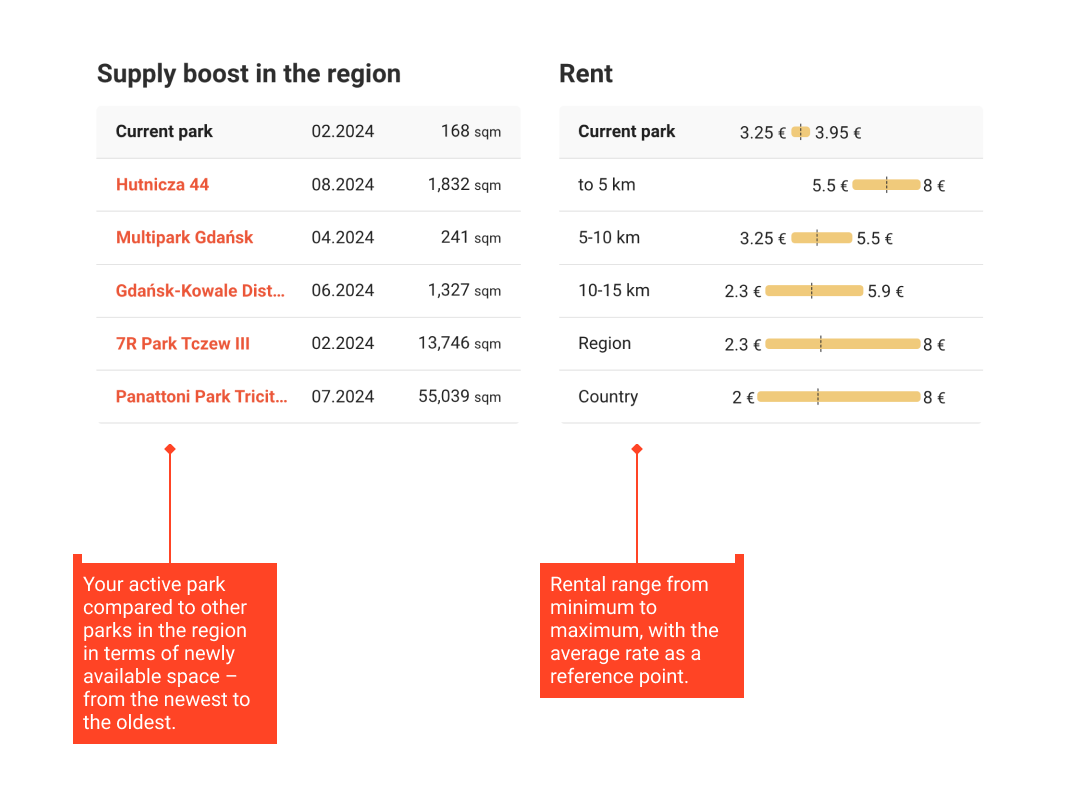
“Warehouses located near each other typically share similar characteristics: age, class, and quality. Moreover, they tend to attract similar potential tenants. That’s why, in designing the new industrial building cards, we decided to focus on location and provide data on properties situated within a specific distance from the analyzed building. Offering a full overview of properties within a given area gives a more comprehensive picture of the micro-market around a particular location” – explains Krzysztof Foks, Head of Research at REDD.
There’s a saying that changing the rules during the game is unfair. But what if the new rules level the playing field and make competition less stressful? With REDD’s new building card, users gain a tool that redefines the rules of the game in the real estate market. Automated comparisons with competitors and the market, powered by an intelligent algorithm, not only speed up decision-making processes but also provide critical data for effective negotiations, benchmarking, and reporting. This tool not only streamlines daily work but also aligns with the mission of creating a more transparent real estate market, where access to information becomes a standard rather than a competitive advantage.
Log in to REDD now and discover how these solutions can streamline your work. Don’t have an account yet? Join REDD Basic and test the new functionalities for free – but hurry, this offer is time-limited! ⏳


